How to read the numbers above
The dashboard consults official sources from Nepal and keeps only aggregate totals. The death count comes from Nepal Police bulletins. The numbers of missing, rescued and found come from SETU, the system of the National Disaster Risk Reduction and Management Authority of Nepal, the NDRRMA.
These bases fulfill different functions. A missing person Not a death to be confirmed, and the totals should not be added up. SETU can also receive repeated registrations. Therefore, TecEdi only eliminates exact duplicates before showing the totals and does not store names, telephone numbers or addresses of the registered people.
The graph tracks the reports of confirmed deaths. The buttons allow you to gather the history by days, months, or years. At each interval, the last available bulletin appears. Since the disaster began on August 26, 2026, the monthly and annual views are still low, but they will make sense if the monitoring remains active for longer.
What happened on August 26
The water level began to rise rapidly around 9 a.m. in Rasuwa district, according to the International Centre for Integrated Mountain Development, the ICIMOD. The wave carried water, mud, sediment and large blocks through the Lende Khola, reached the Bhote Koshi and followed for the Trishuli River system.
The disaster was not restricted to the point of origin. The flow advanced to areas of Nuwakot and Dhading and continued to carry debris to downstream districts. Roads, bridges, monitoring stations, markets, housing, and hydroelectric facilities were damaged or carried away by the current.
Hydrological data helps to measure the speed of change. A World Meteorological Organization reported that the level of Trishuli rose up to nine meters in 30 minutes in Galchhi. In Malekhu, the rise reached seven meters in a similar interval. It is too small a window to rely only on traditional alerts and land travel.
The disaster recorded by those who were at the scene
Warning: The videos below show real flooding, destruction, and people trying to escape. There is no autoplay.
The first record brings together images taken by the Nepal Red Cross Society in Rasuwa. The recording shows the water laden with mud and debris advancing through the valley. The video was published by the No Comment TV channel and remains embedded on the page, with no copy of the file by TecEdi.
The second video was recorded by a worker in Mailung. It records the moment when the current invades the area and forces the group to run to a higher point. According to Al Jazeera English, the author of the recording was rescued by helicopter with other workers.
These images help to understand the speed of the flow, but they are not a substitute for official measurements. Times, locations and causes need to be confirmed with hydrological data, seismic records, satellites and field observations.
Did the mountain collapse?
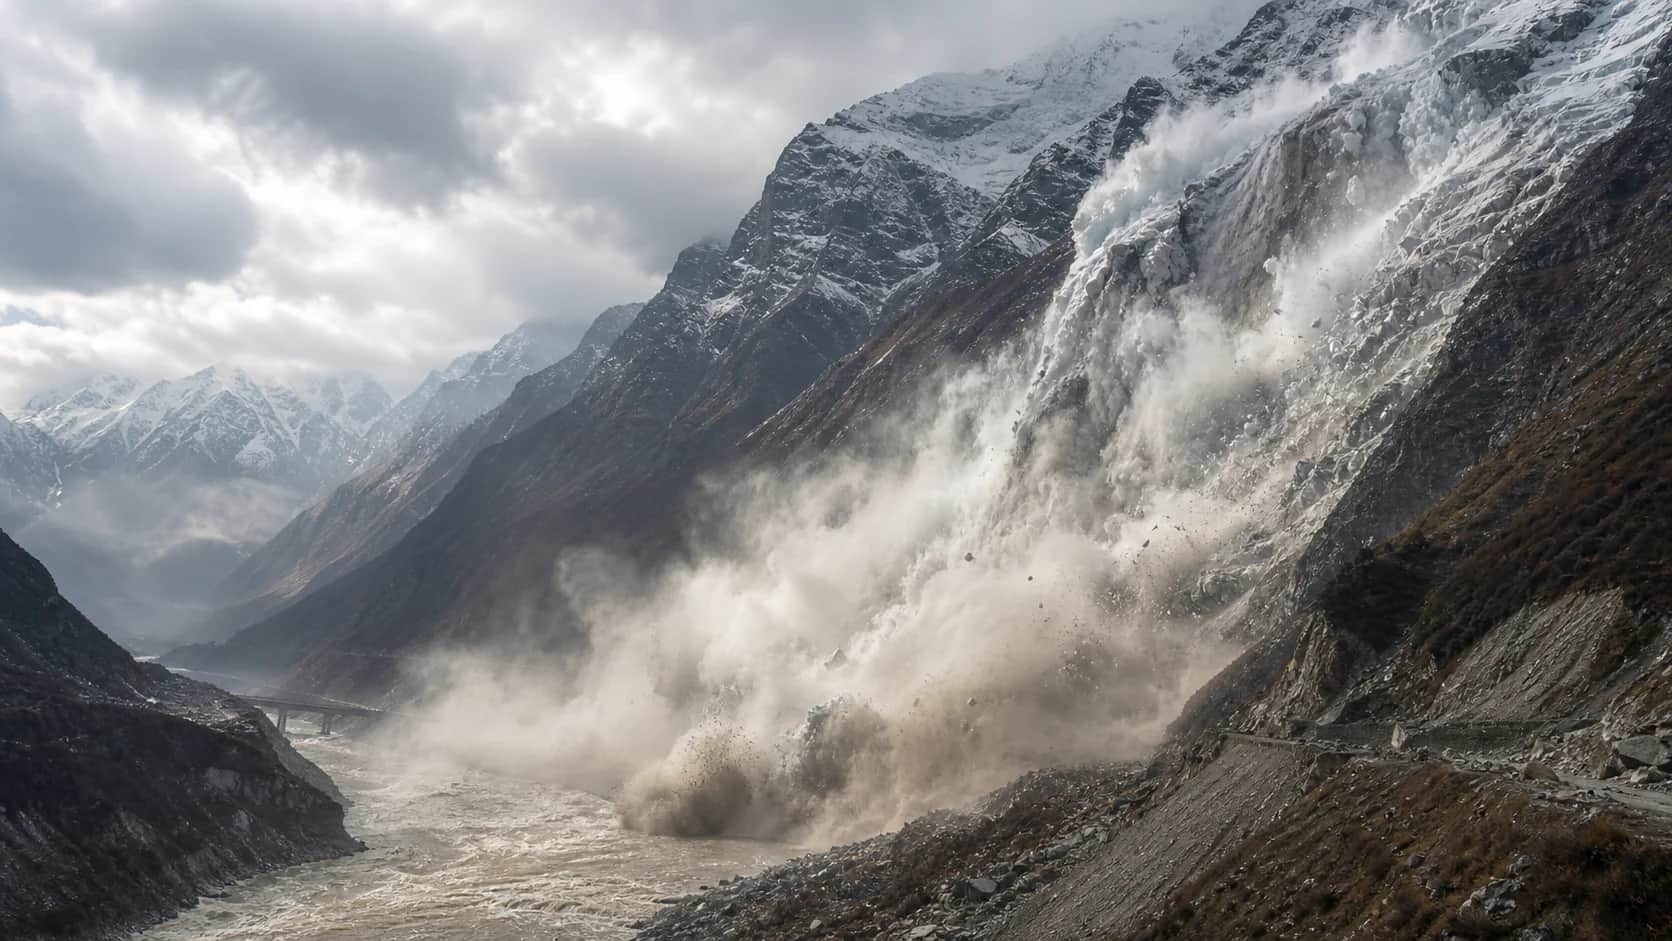
The main hypothesis being investigated is the fall of a large mass of ice and rock in an elevated area near the border between Nepal and China. This material may have entered the narrow valley of the Lende Khola and created a very rapid wave of debris.
Another possibility is that the debris temporarily blocked the river. If this natural dam broke, the dammed water would have amplified the flood pulse. Scientists are also analyzing abnormal seismic signals recorded near the region, but ICIMOD warns that The definitive cause has not yet been established.
That difference matters. Stunning images may suggest a simple conclusion, but a chain disaster involves ice, rock, relief, water, rainfall, and already vulnerable structures. Linking the episode directly to a single earthquake or attributing it definitively to climate change, without the analysis completed, would go beyond the available evidence.
Climate change alters glaciers, snow, permafrost and slopes in the Hindu Kush Himalayas, increasing regional risks. Still, the researchers say it is too early to measure its role in this specific event.
Why the number of victims changes so fast
In the first few hours, teams registered victims near the hardest-hit points. Later, bodies were found much further down the course of the rivers. At the same time, families, employers, local authorities and search teams sent lists of people without contact.
This creates three challenges. The first is geographical: a victim can be located far from where they disappeared. The second is operational: different bodies can register the same person in slightly different ways. The third is human: someone initially missing can be found alive, rescued, hospitalized, or identified among the victims.
For this reason, the TecEdi panel does not transform the absence of contact into an estimate of deaths. It shows each situation with its name and keeps the time of the last consultation. If an official source becomes unavailable, the system keeps the last valid portrait and warns that the data may be outdated.
Drones go where the road doesn't
Nepal Police deployed teams with cameras, communications equipment and drones to document damage and support the assessment of the affected sites. The use of small aircraft is especially valuable when bridges have disappeared, slopes remain unstable and roads are blocked.
A drone can observe a stretch of river without immediately placing a team on the ground. It can also search for access routes, identify new obstructions, locate isolated groups, and compare images of the same area throughout the day.
But the camera doesn't solve everything. Rain, clouds, terrain, battery life, and lack of connection limit flights. An image also needs to be interpreted by professionals who know the terrain. The drone works as an extension of the team's eyes, not as a substitute for human search.
Satellites show the scale of the disaster
Satellite imagery allows you to compare the valley before and after the flood. They help measure the area covered by sediment, locate changes in the course of the river, observe bridges and roads that are interrupted, and guide priorities when land access is impossible.
The animation below alternates a Copernicus Sentinel image, taken on August 24, with a Landsat 9/USGS image from August 26. The comparison shows the rupture scar on the slope and the sediment corridor that flowed down the valley. Clouds hide part of the terrain, so the sequence should be read as visual support, not as a complete reconstruction of the collapse dynamics.
The United Nations and partners use remote sensing to support the assessment of the extent of the damage. In the case of Rasuwa, high-resolution analyses are also needed to locate the origin of the ice and rock avalanche and to see if there is still unstable material or blockage in the valley.
Satellites do not offer perfect transmission. Passage over the area occurs at set times, clouds can hide the ground, and higher-resolution images are not always immediately available. Therefore, the most reliable reading combines satellite, drone, sensors in the river, seismic records and field observation.
Sensors gave an alert, but part of the network was lost
Hydrological stations recorded Trishuli's exceptional rise. At the same time, several monitoring points were damaged or washed away by the flood. This shows a common contradiction in disasters: the same network that measures the crisis is also exposed to it.
Redundancy is the technical answer. Stations in different locations, communication over more than one network, backup power supply, and data sharing between countries reduce the chance of silence at precisely the most critical moment.
The event began near a border and quickly turned into a risk for distant communities. For WMO and ICIMOD, cross-border warning systems need to turn observations into understandable messages and quick decisions. It is not enough to detect the wave. It is necessary to warn those below, indicate a safe route and ensure that the community knows how to act.
The role of BIPAD and SETU
O BIPAD is Nepal's government platform for disaster information. Its API records verified occurrences, location, type of hazard, and associated losses. At this time, however, it still does not gather the entire human balance of the Rasuwa flood. The dashboard reports this limitation instead of presenting zeros as if they signify no casualties.
This use of public layers is reminiscent of what we explained in the article on the God's Eye View and the limits of a map that gathers signs of the planet. The preview makes it easy to read, but the quality remains dependent on the source, freshness, and context of each record.
O SETU It meets another need: to organize records of missing, rescued and found persons. For TecEdi, it is consulted only to produce counts. No personal data from the list is copied to the portal.
This separation between sources is less elegant than a single accountant, but it is more honest. In an ongoing emergency, transparency about the origin and quality of the data is worth more than the appearance of absolute accuracy.
What still needs to be confirmed
Researchers are still trying to determine the exact point of collapse, the volume of ice and rock, whether or not a temporary dam was formed, and the influence of weather conditions and slope stability.
Teams also need to reconcile lists, identify victims, and reach isolated areas. New rains increase the risk of landslides and secondary debris flows. Therefore, numbers, maps, and hypotheses can still change.
TecEdi will update the dashboard from official sources, but will keep the interpretive text under editorial review. An API can report that a number has changed. It cannot, on its own, explain why it has changed or assess whether two databases are talking about the same people.
A tragedy that also exposes a technological failure
Drones, satellites, sensors, and data platforms help to see what would be invisible and organize a larger response. The disaster, however, shows the limit of a technology that arrives after the wave.
The key challenge is to shorten the path between detection and action. This requires resilient networks, data shared between countries, alerts in local language, known evacuation routes, and communities prepared to respond within minutes.
In Rasuwa, the technology helps find people, map damage, and understand the source of the disaster. The hardest lesson is that it also needs to work earlier, when there's still time to get out of the way.
Sources consulted